2.2.2 PAT Simulator
PAT's simulator allows users to interactively and visually simulate
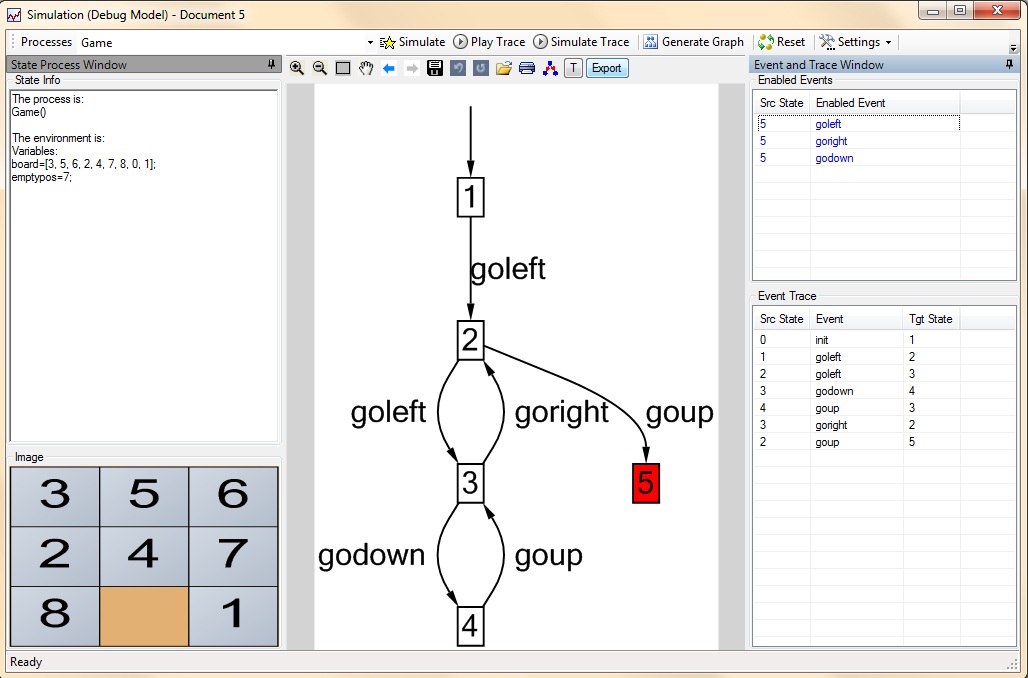
system behaviors. The simulator is made up of four parts: Toolbar on the
top, Interaction Pane, Data Pane (showing the value of the variables at selected
state) and Simulation Graph.
Select the process you want to simulate, the simulation tasks that can be
performed are described as follows.
- Click the Simulate button to do a random simulation of
the system. The simulator will randomly select one enabled event at current
state to execute. The simulation will stop when there is no more enabled
events are available or the number of the visited states is bigger than the
limit. Current state is shown in red color in the graph.
- Double click the event in the "Enabled Events" list to
perform the step-by-step simulation. The "Enabled Events" list will only show
the enabled events for the current state (shown in red
color in the graph). Events shown in blue
color are unvisited events while black color are visited
events for the current state.
- Generate Graph
button will generate the complete state graph in one click. The number of
states to be displayed is bounded by display limit (300 by default) to avoid the
non-termination of the model.
- Select any state in the "Event Trace" list, then click
the Play Trace button to play the trace automatically
starting from the selected state. You may go back to any previous states.
- Simulate Trace button allows users to write a script
to perform automatic simulation. After clicking it, a textbox is shown where
you can writre the event trace like phil.0.0, phil.0.1,
eat.0 or a, b(5), tick. Each event is
seprated by comma and b(5) means you can perform b 5 times.
- Click Reset button to reset the simulator to the initial
state of the selected process.
Note: the number of states that can be generated is limited
to 300 by default. You can change this number in the system configurations.
Counterexample visualization: Click the Simulate button in
the Verifier to view the counterexample. If
the counterexample belongs to a LTL assertion, you can also view the strongly
connected component which generates the counterexample.
Easter egg  : if you try the dining
philosophers or sliding game example (in CSP Module) in PAT, you would
see a picture of the board in the simulator. We are developing more pictures for
other examples.
: if you try the dining
philosophers or sliding game example (in CSP Module) in PAT, you would
see a picture of the board in the simulator. We are developing more pictures for
other examples.
Tips of using Simulator:
- You can move your mouse over the state and transition in the graph to see
the detailed information.
- You can drag the node and edges in the Simulation Graph.
- You can adjust the simulation speed in the toolbar settings button:
very fast, fast, normal, slow, very slow.
- You can adjust the tooltip popup delay in the toolbar
settings button: 5s, 10s, 20s, 40s, 60s.
- You can hide all the tau transitions in the toolbar
settings button.
Copyright © 2007-2012 Semantic Engineering Pte. Ltd.
 Process
Analysis Toolkit (PAT) 3.5
Help
Process
Analysis Toolkit (PAT) 3.5
Help